Coexpression and Differential Expression search
Table of contents
Running a Search
Setting up the query
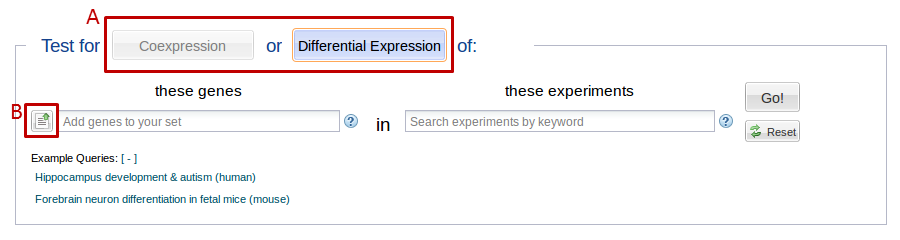
1. Select whether you want to search for Differential Expression or Coexpression. See figure 1 below.
 |
2. Select genes to find differential expression data for.
This can be done by selecting a pre-made group or by searching for experiments and using the results.
- Selecting a pre-made group
- When you click in the gene search box, you may be prompted with a list of gene groups.
- Prompted groups can include groups made by Gemma administrators, groups you have saved (if you are logged in) and temporary (unsaved) groups
- Searching for genes
- Genes can be found by key word, which will match to gene symbols, names, ontology associations and group names
- Use quotation marks to search for phrases, e.g “cell junction”.
- Using a list of symbols or NCBI IDs
- If you already know which genes you want to use for your search, you can paste them in by symbol or NCBI ID
- Click on the button just to the left of the gene search box to open a window to paste in your list (See figure 1, box B).
- Each gene should be on one line.
3. Select experiments from which we’ll pull expression data.
- Selecting a pre-made group:
- When you click in the experiment search box, you will be prompted with a list of experiment groups.
- Prompted groups can include groups made by Gemma administrators, groups you have saved (if you are logged in) and temporary (unsaved) groups.
- Searching for experiments:
- Gemma has thousands of experiments for you to use.
- Try searching these experiments by keyword (hippocampus, autism), array design (GPL96) or GEO id (GSE28521).
- Keyword searches look for matches in experiment accessions, names, descriptions, array designs, curator-assigned tags and group names.
- You can search using word roots, like “hypothala”.
Viewing, refining and saving your selections
The following applies to both gene and experiment selections
Once you have made a selection, you can add to it using the search boxes in the selection preview area.
To remove elements from your selection or to save your selection, use the edit/save icon in the top right of the preview areas (See figure 2, box A).
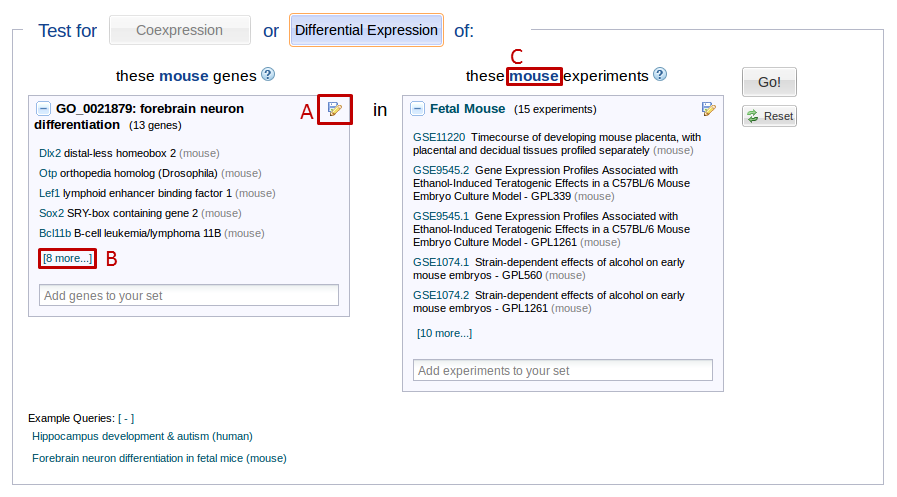 |
For example, let’s say you search for “hippocampus” and select the “hippocampus development” Gene Ontology (GO) group. The gene preview pane now shows you a preview of the genes you have selected. If you want to see all the genes included in this GO group, you can press the “# more…” link at the bottom of the selection pane. (See figure 2, box B) This will bring up a list of the genes in your selection. You can use the “X” buttons on every line to remove genes from your selection or use the search box at the top to add genes.
Now that you have edited your “save” button), it will be permanently available to you. If you aren’t logged in or don’t want to save your changes, you can press the “done” button which will let you use your edited selection for this search. Gemma will remember your edited selection for some time, but we can’t guarantee it will be around for long (if your cache is cleared or we restart our servers, your unsaved selections will be gone). You can have three unsaved edited selections at a time; when you create a fourth, the oldest unsaved edited selection will be replaced.
Taxon mode
Searches are limited to queries made up of experiments and genes from one taxon. Once you select a gene or experiment, all your subsequent selections will be limited to the taxon of your first selection (See figure 2, box C).
To switch taxa, press the “reset” button to the right.
Search results
Differential Expression results
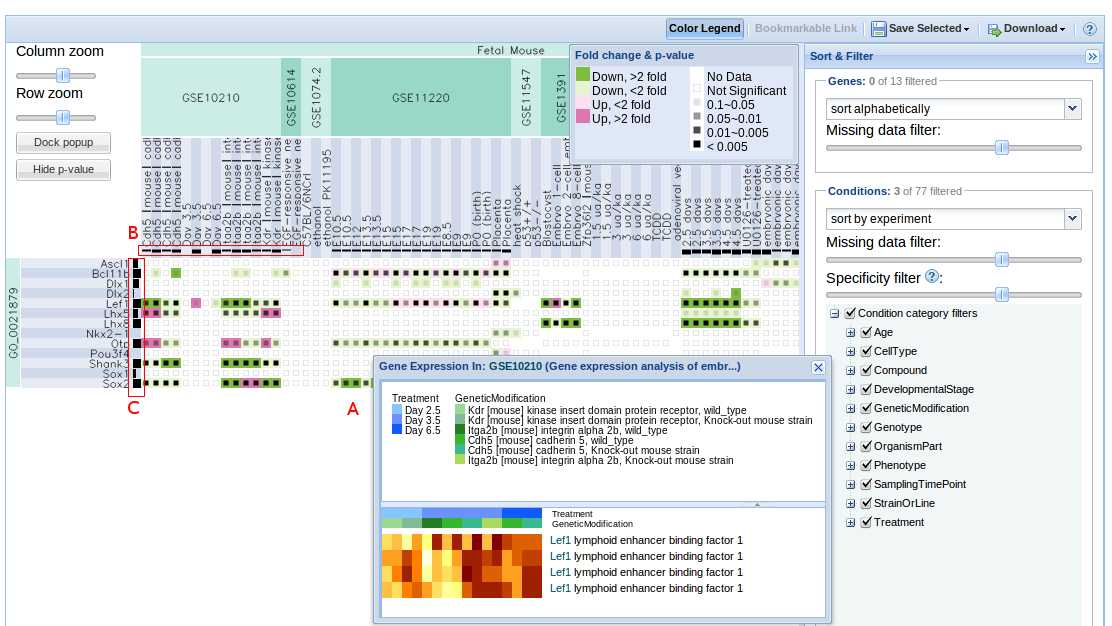
The results are displayed as a heatmap of genes (y-axis) vs conditions (x-axis).
Each cell displays the differential expression results for that gene under that condition versus a baseline in one experiment. If more than one probe is mapped to the same gene probe with the best p-value is shown. Hover over a cell to see the specifics of the differential expression:
- fold change: log transformed and shown with cell colour - green (down), red (up).
- p value: shown by the opacity of the black inner rectangle - from transparent (p > 0.1) to black (p < 0.00001).
Empty cells indicate missing data. If the inner rectangle is blank it means that the analysis was done but the result is not significant (high p-value).
For more details, click on the “Color Legend” button in the top toolbar.
Clicking on a cell brings up a heatmap of the expression levels for that gene and condition, broken down by probe and factor value (see figure 3, box A).
 |
Condition enrichment: This is a p-value associated with hypergeometric test (or binomial approximation). It shows how enriched for differential expression your set of genes is with respect to all other genes under that condition.
Gene meta p-value: This is computed using Fisher’s method for combining p-values (Cooper and Hedges 15-8). This is done for each gene in selected conditions.
The enrichment of each condition is displayed in the column header (see figure 3, box B). The thicker the bar, the more specific the differential expression.
The meta p-value for each gene is displayed in the row header (see figure 3, box C). The thicker the bar, the more significant the p-value.
Sort and filter
You can change the layout of your results to discover and clarify patterns. The tools for sorting and filtering are on the right panel of the search results. This panel is collapsible using the small double arrows at the top right (“»”).
Genes
- Sort: You can sort genes either alphabetically or by meta p-value.
- Missing data filter: When the data is missing for a cell, a small grey “x” is shown. This filter allows you to hide genes that are missing data for more than the specified percent of conditions.
Conditions
- Sort: Conditions can be sorted by experiment (default), specificity or enrichment (see definitions above). When sorting by the latter two, conditions are grouped by factor instead of experiment.
- Missing data filter: When the data is missing for a cell, a small grey “x” is shown. This filter allows you to hide conditions that are missing data for more than the specified percent of genes.
- Specificity filter: Hide conditions with low specificity (see definitions above) by moving the slider to the left.
- Condition category filter: Hide conditions by their factor category. Use the top level check box to select all or none.
Downloading your results
Save an image of your chart or save a text version (file format is described in the file header) of the results using the “Download” button at the top right of the visualiser.
Create gene and experiment sets
You can select genes and conditions by holding down the CTRL key and clicking on row and column headers. You can save your selections as gene and experiment sets in Gemma using the “Save Selected” button in the top toolbar. You can also get a text version of your selections by pressing this button and then clicking on “Export” in the window that pops up. For more information visit our Gene and Experiment Sets guide.
Coexpression results
Your results are displayed in two formats: tabular and visualisation (node-edge chart).
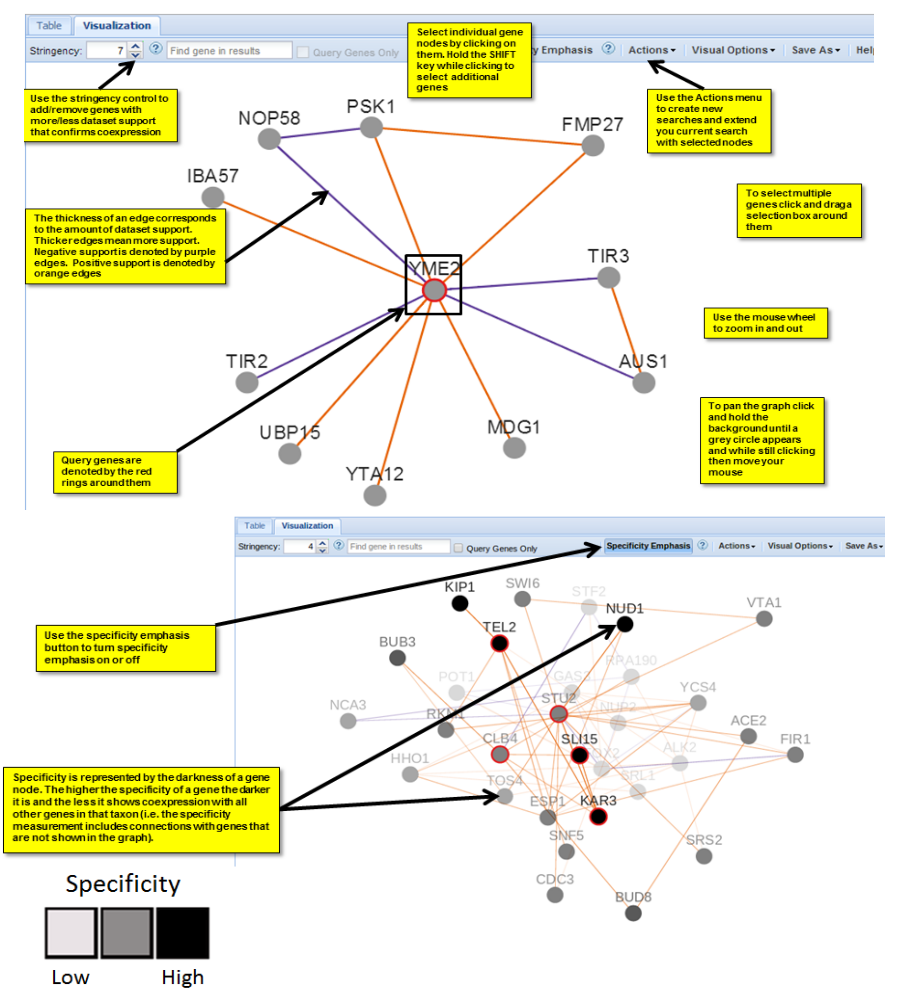
Stringency: The level of support required to consider two genes coexpressed. The higher the stringency, the more dataset support required.
Specificity: A measure of the specificity of a gene’s coexpression. The higher the specificity of a gene is, the darker it is and the less it shows coexpression with all other genes in its taxon.
In the tabular version, the “Support” column shows the number of datasets that confirm the coexpression. Green numbers support positive coexpression while red numbers support negative coexpression. Use the icons on the far right of each row to visualise the expression patterns for the two coexpressed genes in each of the supporting experiments.
The visualisation is described in figure 4 below.
Note about trimming of weakly supported coexpression search results (applicable for small searches of 20 query genes and under)
In order to efficiently display coexpression results to the web browser, we trim your search based on the following:
Search results contain (up to) the top 200 results per gene in your query gene list ordered by the strength of support(i.e. number of datasets showing coexpression, the stringency) of each coexpression link.
In addition to these top 200 results, we also display all results between query genes regardless of the support.
Note about large searches (over 20 query genes)
If you gene set search list has more than 20 genes in it, then your search will be run as a ‘query genes only’ search. This means that all of the results(if any) will display only coexpression links between genes in your gene set search list.
If the results of this large search is over 2000 results, we trim the result set by removing the most weakly supported(low stringency) links until the result set is under 2000 and then return these results to the browser. We do this for browser performance reasons (both in the table and graph views).
Please use the Gemma web services if you wish to retrieve a more complete list of search results.
 |